
Stablecoin Oddity
Why stablecoin issuance is declining (for now)

Last September, Citi forecast stablecoin issuance to reach $1.9trn - $4trn in 20301. Soon after, the US Treasury secretary predicted stablecoins would create $3trn of demand for US Treasuries2.
At the time, the total value of stablecoins in issuance was around $290bn which rose slowly to $315bn in May this year3. To reach Citi’s targets and US government expectations, we should be seeing stablecoin issuance increasing at between $130bn to $200bn annually.
Yet, in early August 2026, their total value is barely $300bn (footnote 3) – issuance has gone backwards.
What’s going on?
The short answer is the drop in the price of Bitcoin and other cryptocurrencies has reduced demand for stablecoins, causing issuance to stall/fall.
Those enthusing about stablecoins are quick to point out the $300bn stablecoin value and $45trn annual trading as evidence of strong demand but either they ignore the overwhelming cryptocurrency influence on these numbers or they are unaware of it. Until about a year ago, stablecoins were used almost exclusively to buy and sell cryptocurrencies.
Then, Bitcoin’s price peaked on 6 Oct 20254 and has since fallen by around 50%. The number of Bitcoins traded each day has also fallen, from an average of 522,000 BTC per day in 2025 to 495,000 BTC per day so far this year (end of July 2026)5
Consequently, the traded values of Bitcoin and cryptocurrencies have fallen and along with them, so has the traded value of stablecoins. Fewer stablecoins are needed for cryptocurrency trading, hence the total stablecoin value in circulation has also fallen.
However, I estimate using historical comparisons, that the current level of cryptocurrency trading requires only about $240bn of stablecoins in circulation, compared to the actual $300bn.
This implies that around $60bn of stablecoins are being used for other purposes.
Let’s investigate.
Stablecoin Traded Value
In July 2025, in an article6 on stablecoin usage I included a scatter graph showing the daily transacted value of the main stablecoins plotted against the daily transacted value of the top five cryptocurrencies (by total token value in circulation) for the first half of 2025.
This graph is reproduced in Figure 1. The trend line shows a close correlation between the stablecoin and cryptocurrency daily traded values (R2= 96%).
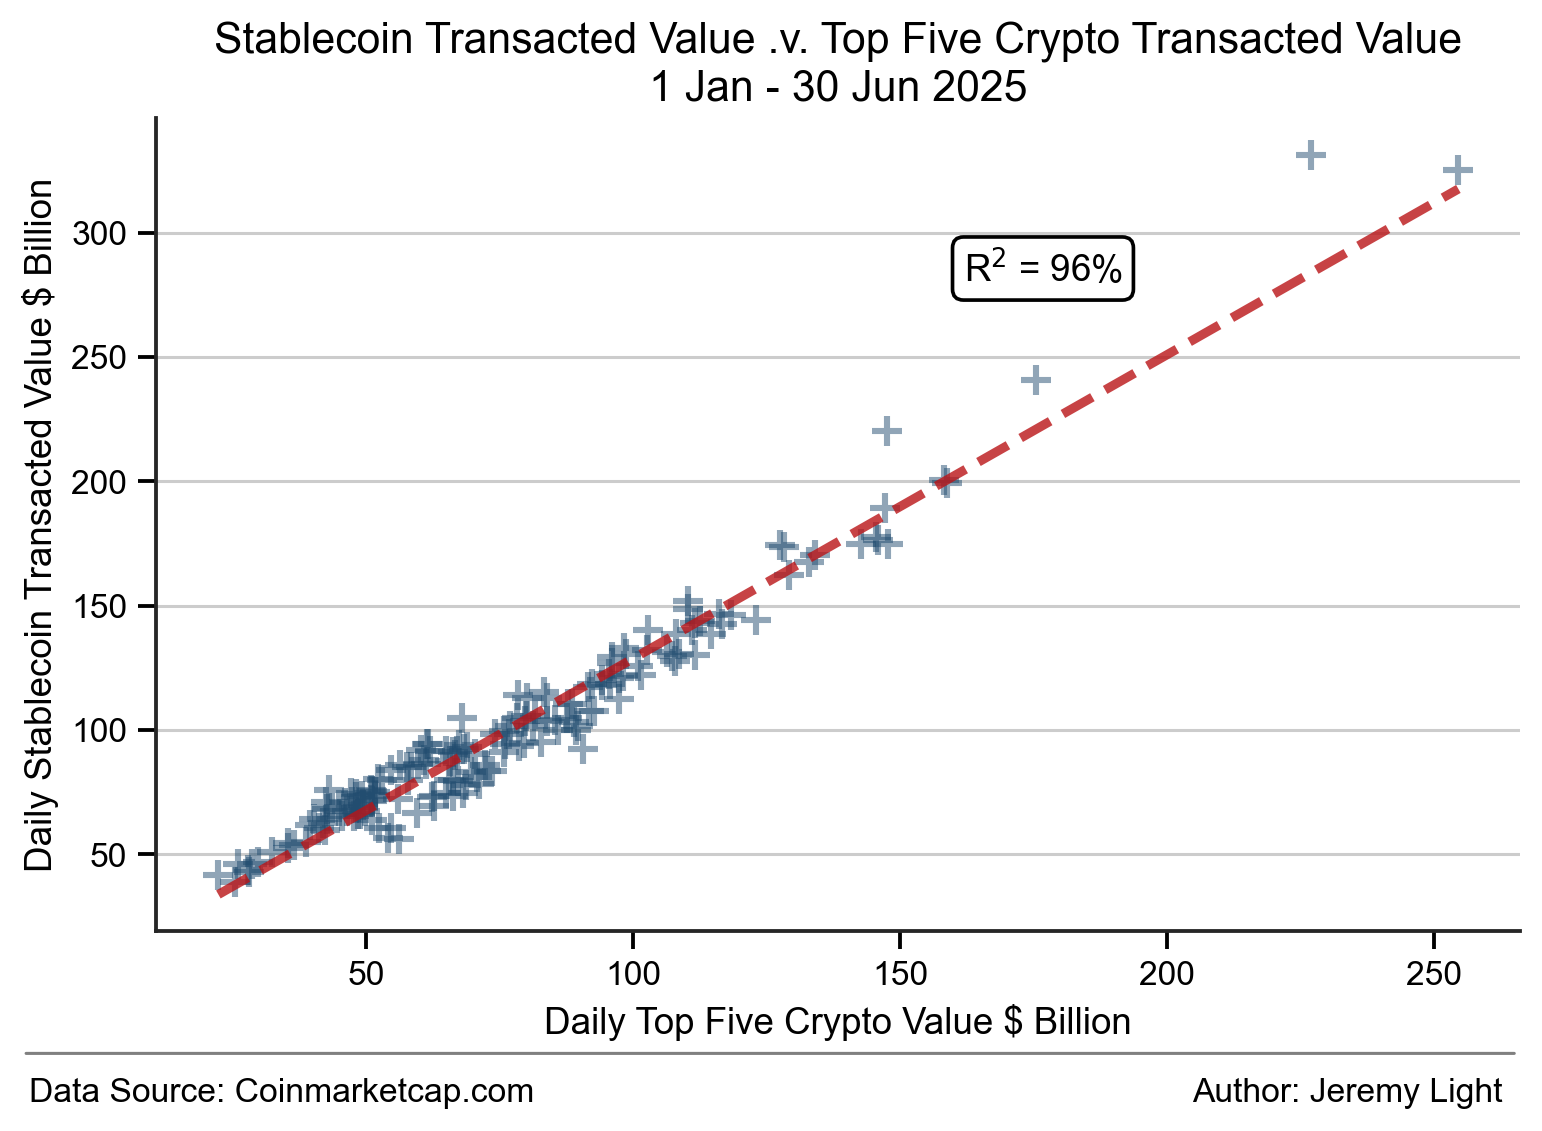
Figure 1 – Correlation between stablecoin (USDT, USDC, PYUSD, FUSD, RLUSD) combined daily transacted value and the top five crypto combined daily transacted value (BTC, ETH, XRP, BNB, SOL) in H1 2025
Figure 2 shows a similar graph for the same stablecoins and cryptocurrencies7 for the period since then, 1 July 2025 – 31 July 26, 13 months.
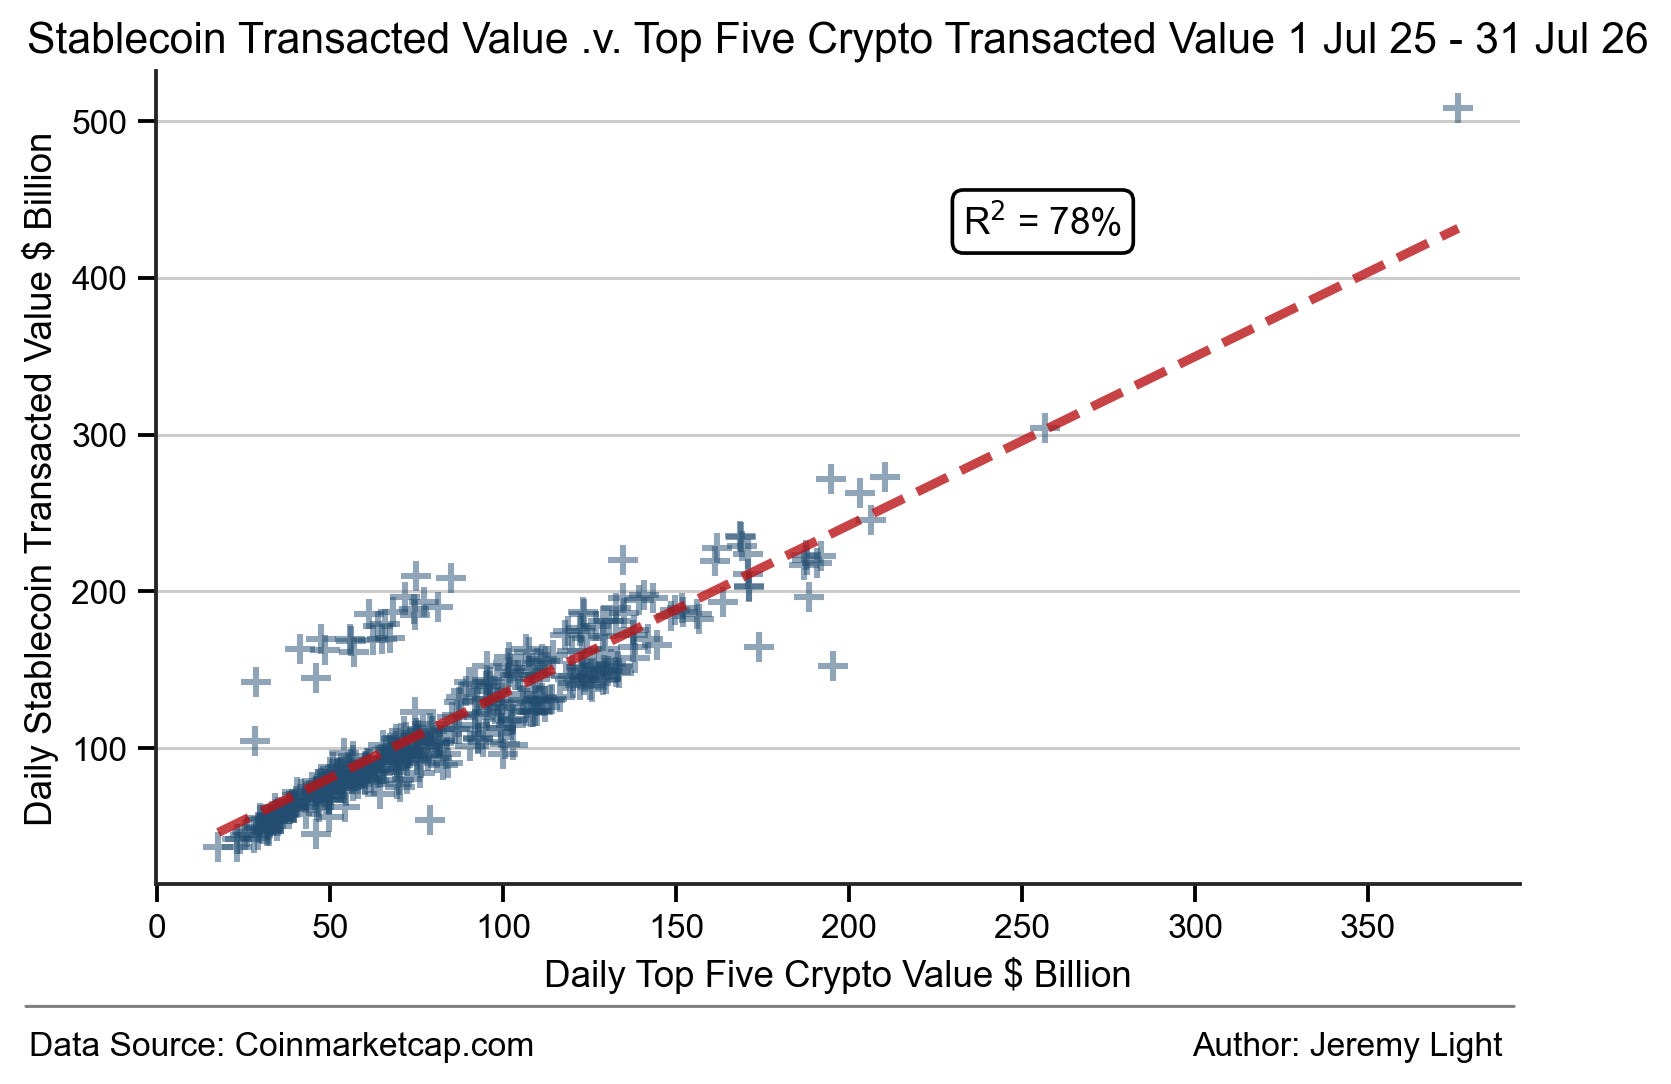
Figure 2 – Correlation between stablecoin (USDT, USDC, PYUSD, FUSD, RLUSD) combined daily transacted value and the top five crypto combined daily transacted value (BTC, ETH, XRP, BNB, SOL) between 1 July 2025 and 31 July 2026
Three things to note in Figure 2 are:
1. The date of the highest stablecoin trade value (top right) was 11 Oct 2025, the day the Bitcoin price dropped 8%, 11% below its all-time high set five days earlier on 6 Oct 2025. Ethereum also dropped 12% that day. 11 Oct 2025 was a peak trading day for cryptocurrencies.
2. There is a cluster of points forming a trend line above and parallel to that shown. I have done some cursory analysis on this cluster and there is no obvious reason for it such as a pattern of dates for the points (although they all occur in 2026).
3. the graph’s trend line shows a significant drop in correlation between cryptocurrencies traded and stablecoins, (R2= 78%) compared to that in Figure 1.
Estimating Stablecoin Usage Outside of Cryptocurrency Trading
Figures 1 and 2 are useful in approximating stablecoin usage outside of cryptocurrency trading, in two ways:
1. The (1 - R2) percentage is a proxy for the percentage of the stablecoin daily trade value used outside of cryptocurrency trading:
- for 1 Jan 25 – 30 Jun 25, 4% equating to $4bn per day
- for 1 Jul 25 – 31 Jul 26, 12% equating to $26bn per day
2. the intercept of the extrapolated trend line with the y-axis in each Figure indicates the daily stablecoin traded value at the (theoretical) point where cryptocurrency trading is zero:
- for 1 Jan 25 – 30 Jun 25, $7bn per day
- for 1 Jul 25 – 31 Jul 26, $27bn per day
This analysis is only approximate but it suggests that stablecoins usage for non-cryptocurrency trading has increased from $4bn - $7bn per day in the first half of 2025 to $26bn - $27bn per day over the past 13 months, a five-fold increase.
Stablecoin Uses
Earlier this year I published two articles8 on stablecoin use cases, identifying and quantifying them. These are summarised in Figure 3, reproduced from the second article in footnote 8.
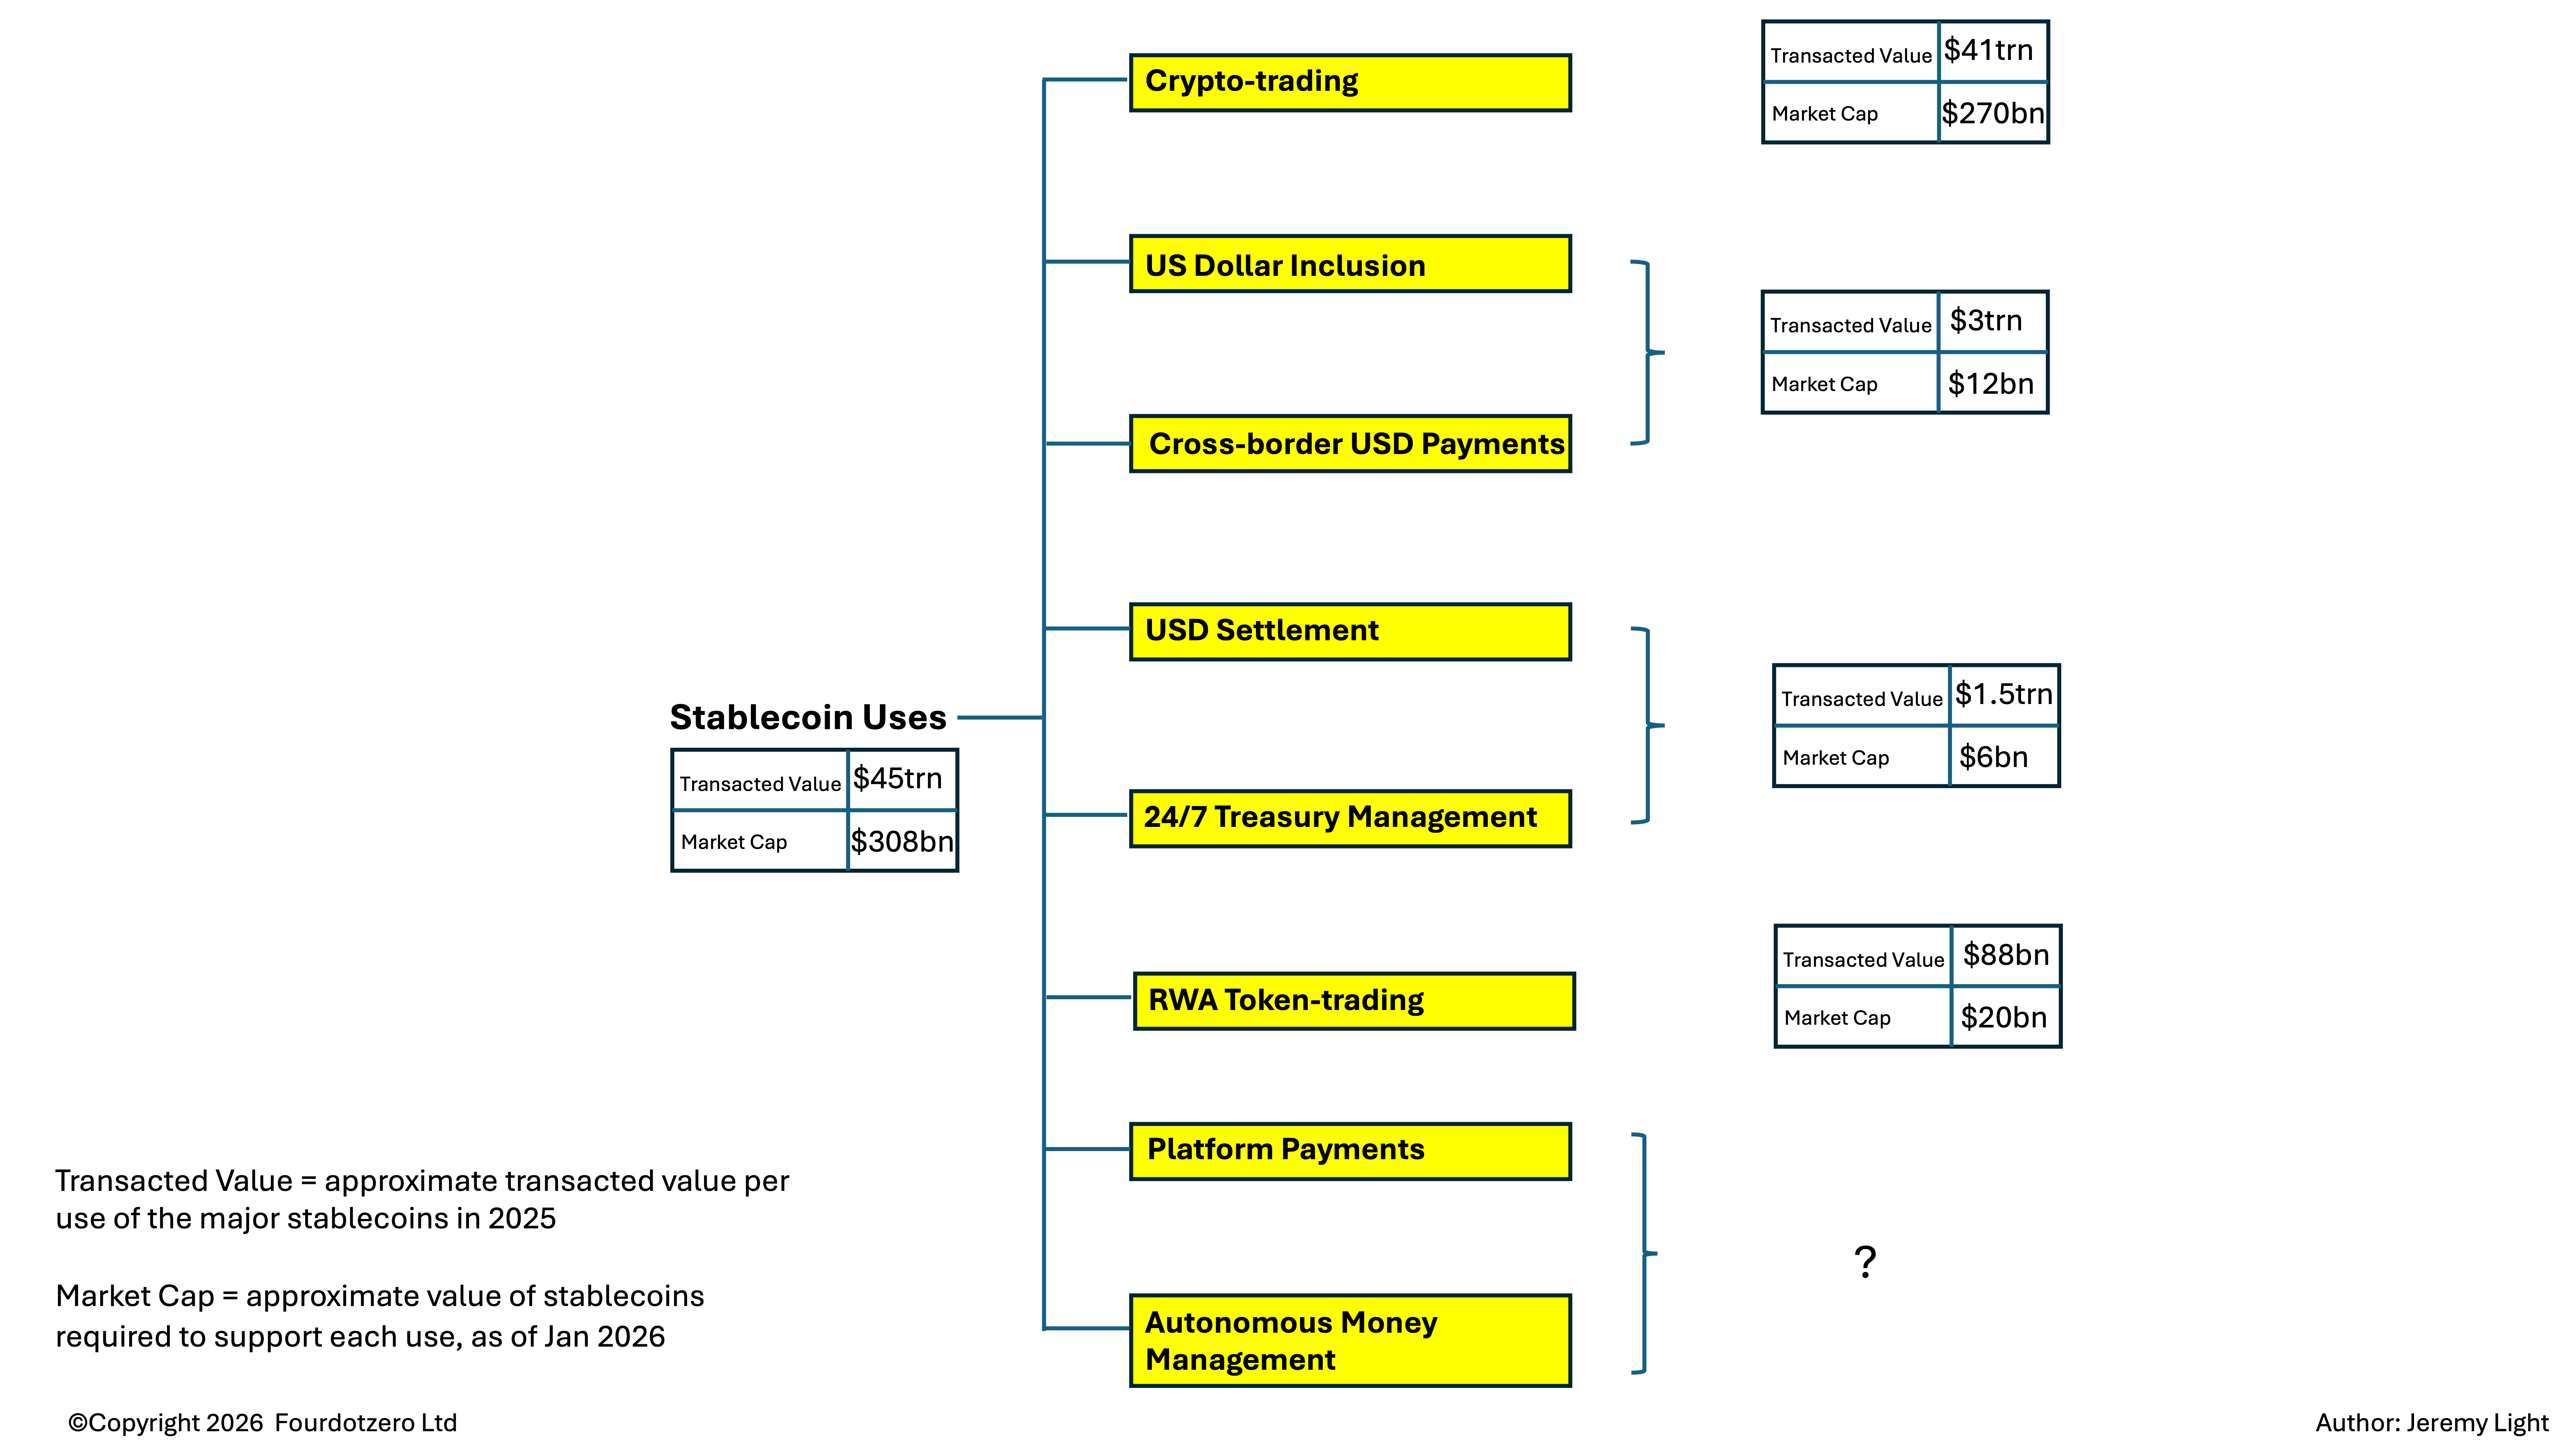
Figure 3 – Stablecoin use cases and approximate distribution of transacted value in 2025
Figure 3 highlights the considerable potential for stablecoins outside of cryptocurrency trading and why it is possible that this usage may indeed be increasing five-fold annually.
Conclusion
At the moment, stablecoin usage is dominated by cryptocurrency trading. Stablecoin traded value and the number in circulation are determined mainly by the price of cryptocurrencies, especially Bitcoin and Ethereum and the demand for them.
It is very difficult to determine the true purpose of stablecoin transactions from blockchain data and quantify how they are used. The dominance of Bitcoin and cryptocurrencies add to this difficulty, with their prices continuing to gyrate wildly, up and down.
Consequently, cryptocurrency trading obscures other, more mainstream uses for stablecoins. However, peering through the data suggests that these mainstream uses are becoming significant, possibly running at close to $30bn per day and increasing five-fold annually.
We should be able to see over the next 12 months, using the approximate methods described here, whether stablecoins are emerging from the shadows of cryptocurrency trading and growing towards the heady heights forecast for them.
The recent decline in stablecoin issuance may look downbeat but it is an oddity due to stablecoins’ origins in the crypto world – in reality, mainstream stablecoin usage could well be on a roll.
Citi stablecoin forecast September 2025: https://www.citigroup.com/global/insights/stablecoins-2030
Defilama: https://defillama.com/stablecoins
Source Coinmarketcap.com
Author’s calculations using volume and price data collected daily from Coinmarket.com
Stablecoin Usage, July 2025: https://jeremylight.substack.com/p/moving-on-up
For consistency (and expediency) the same five stablecoins are covered in the analysis for Figures 1 and 2. USDT and USDC continue to dominate as the top two stablecoins but since June 2025, World Liberty Financial, Global Dollar and Blackrock USD have crept above PYUSD and RLUSD in value, while First Digital USD appears to be in terminal decline. The total difference is about $6bn in issuance, or 2% of the total which is immaterial to this analysis.
Stablecoin use case artilces: https://jeremylight.substack.com/p/sweet-dreams-are-made-of-this and