


Mirror, Mirror On the Wall, Who is Fairest of Them All?
World rankings for real-time payment adoption

Since late April I have written six articles benchmarking the adoption of real-time payments in different regions of the world, covering 69 countries (including the 20 in the Euro zone). There are a further 19 countries (listed at the end) which I believe have real-time payment systems but have no published data and are excluded from the analysis.
The metric for the benchmark is real-time payments per capita.
Combining and ranking the 69 countries, what is the world average and which countries and regions lead in real-time payments?
The World and Regional View
The 2024 world average is 352 real-time payments per capita and Asia Pacific has the highest average at 499 real-time payments per capita. See Figure 1.

Figure 1- Regional comparison of the real-time payment adoption
The volumes in China are so large – 1.3 trillion real-time wallet payments (AliPay, WeChat Pay etc) and 286 billion online and mobile bank payments1 that they make a significant difference to the averages. As shown in Figure 1, excluding China, the world average falls to 103 real-time payments per capita and Asia Pacific to 113, both lower than Africa and Latin America which are leading regions for real-time payments.
Country View
Figure 2 shows the ten countries with the highest real-time payments per capita, reflecting the leadership of Africa, Asia Pacific and Latin America.
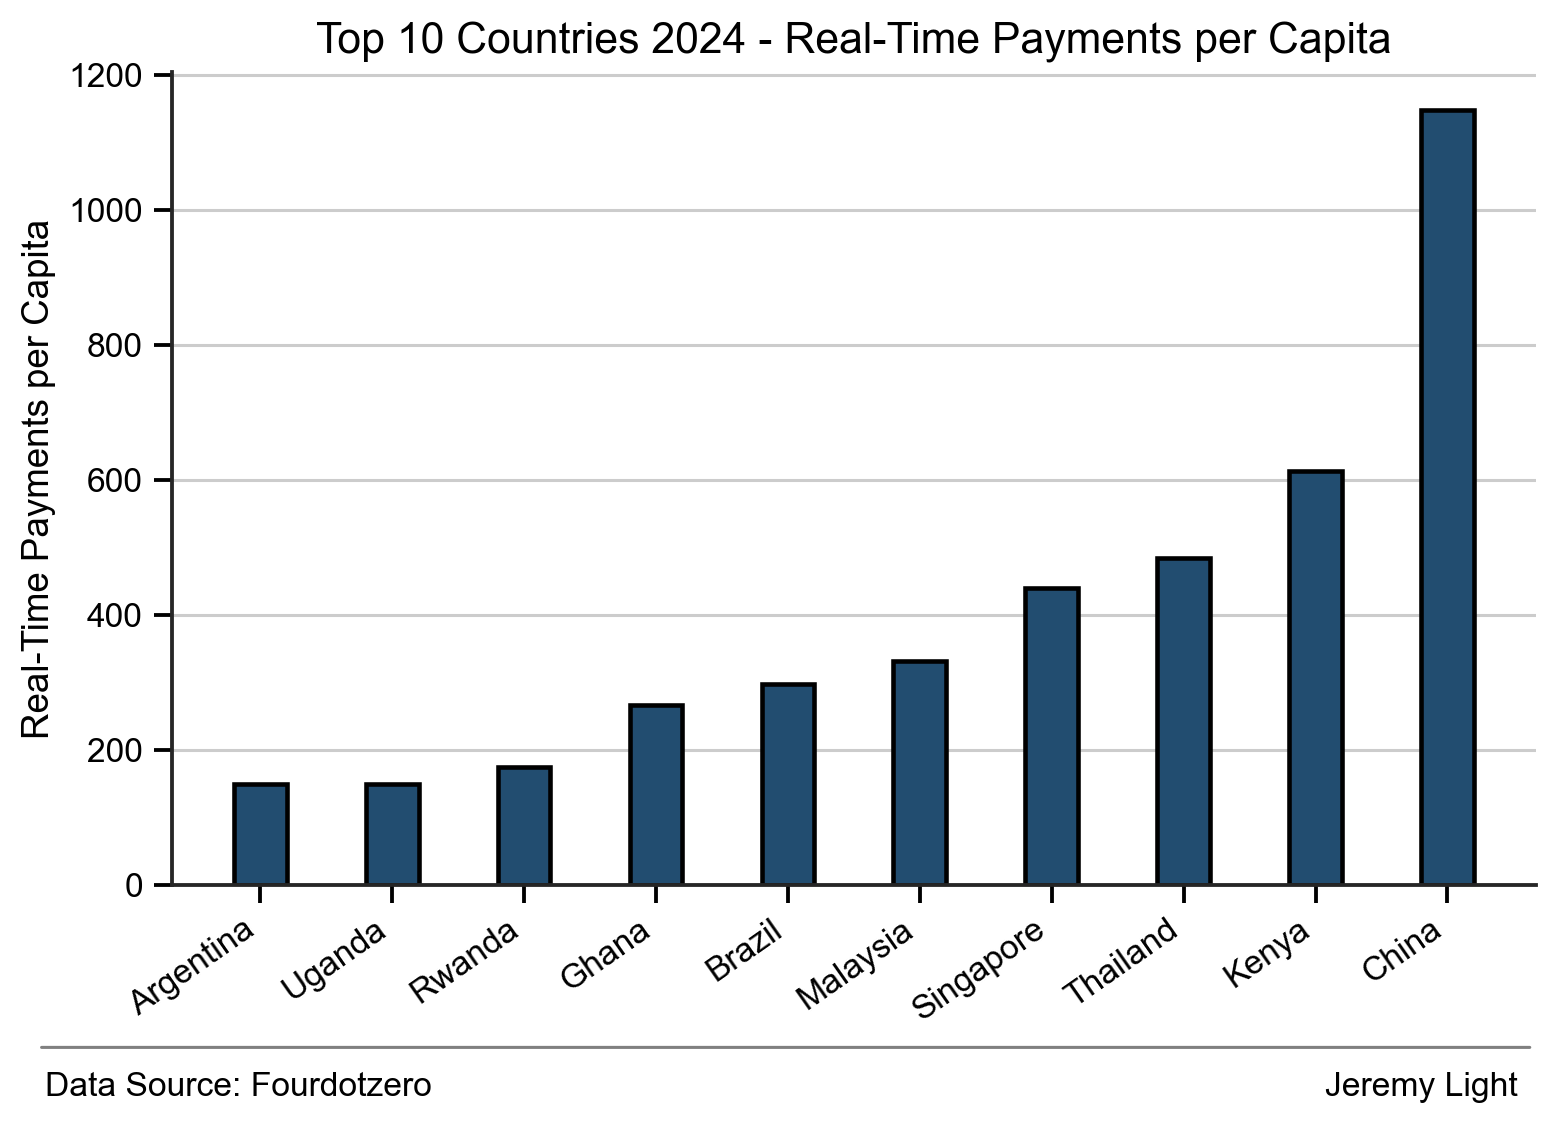
Figure 2 – Ten countries with the highest real-time payment adoption
At 1,147 real-time payments per capita, China is an outlier far ahead of the next highest, Kenya which has 613 real-time payments per capita.
Four African countries make it into the top ten - Uganda, Rwanda, Ghana and Kenya. Their volumes are mainly mobile money transactions (through telcos e.g. Safaricom M-PESA in Kenya, Airtel and MTN in Rwanda). As an example, I estimate Ghana (population 35m) had 9bn mobile money transactions in 2024 and around 140m through the GIP real-time interbank clearing system.
In absolute transaction volume terms China is still the leader, followed by India and Brazil, as shown in Figure 3.

Figure 3 – Countries with the highest absolute real-time payment volumes (no bar shown for China due to scale)
Table 1 ranks all the countries (including the Euro zone as a single bloc) covered in the analysis, ordered by real-time payments per capita.
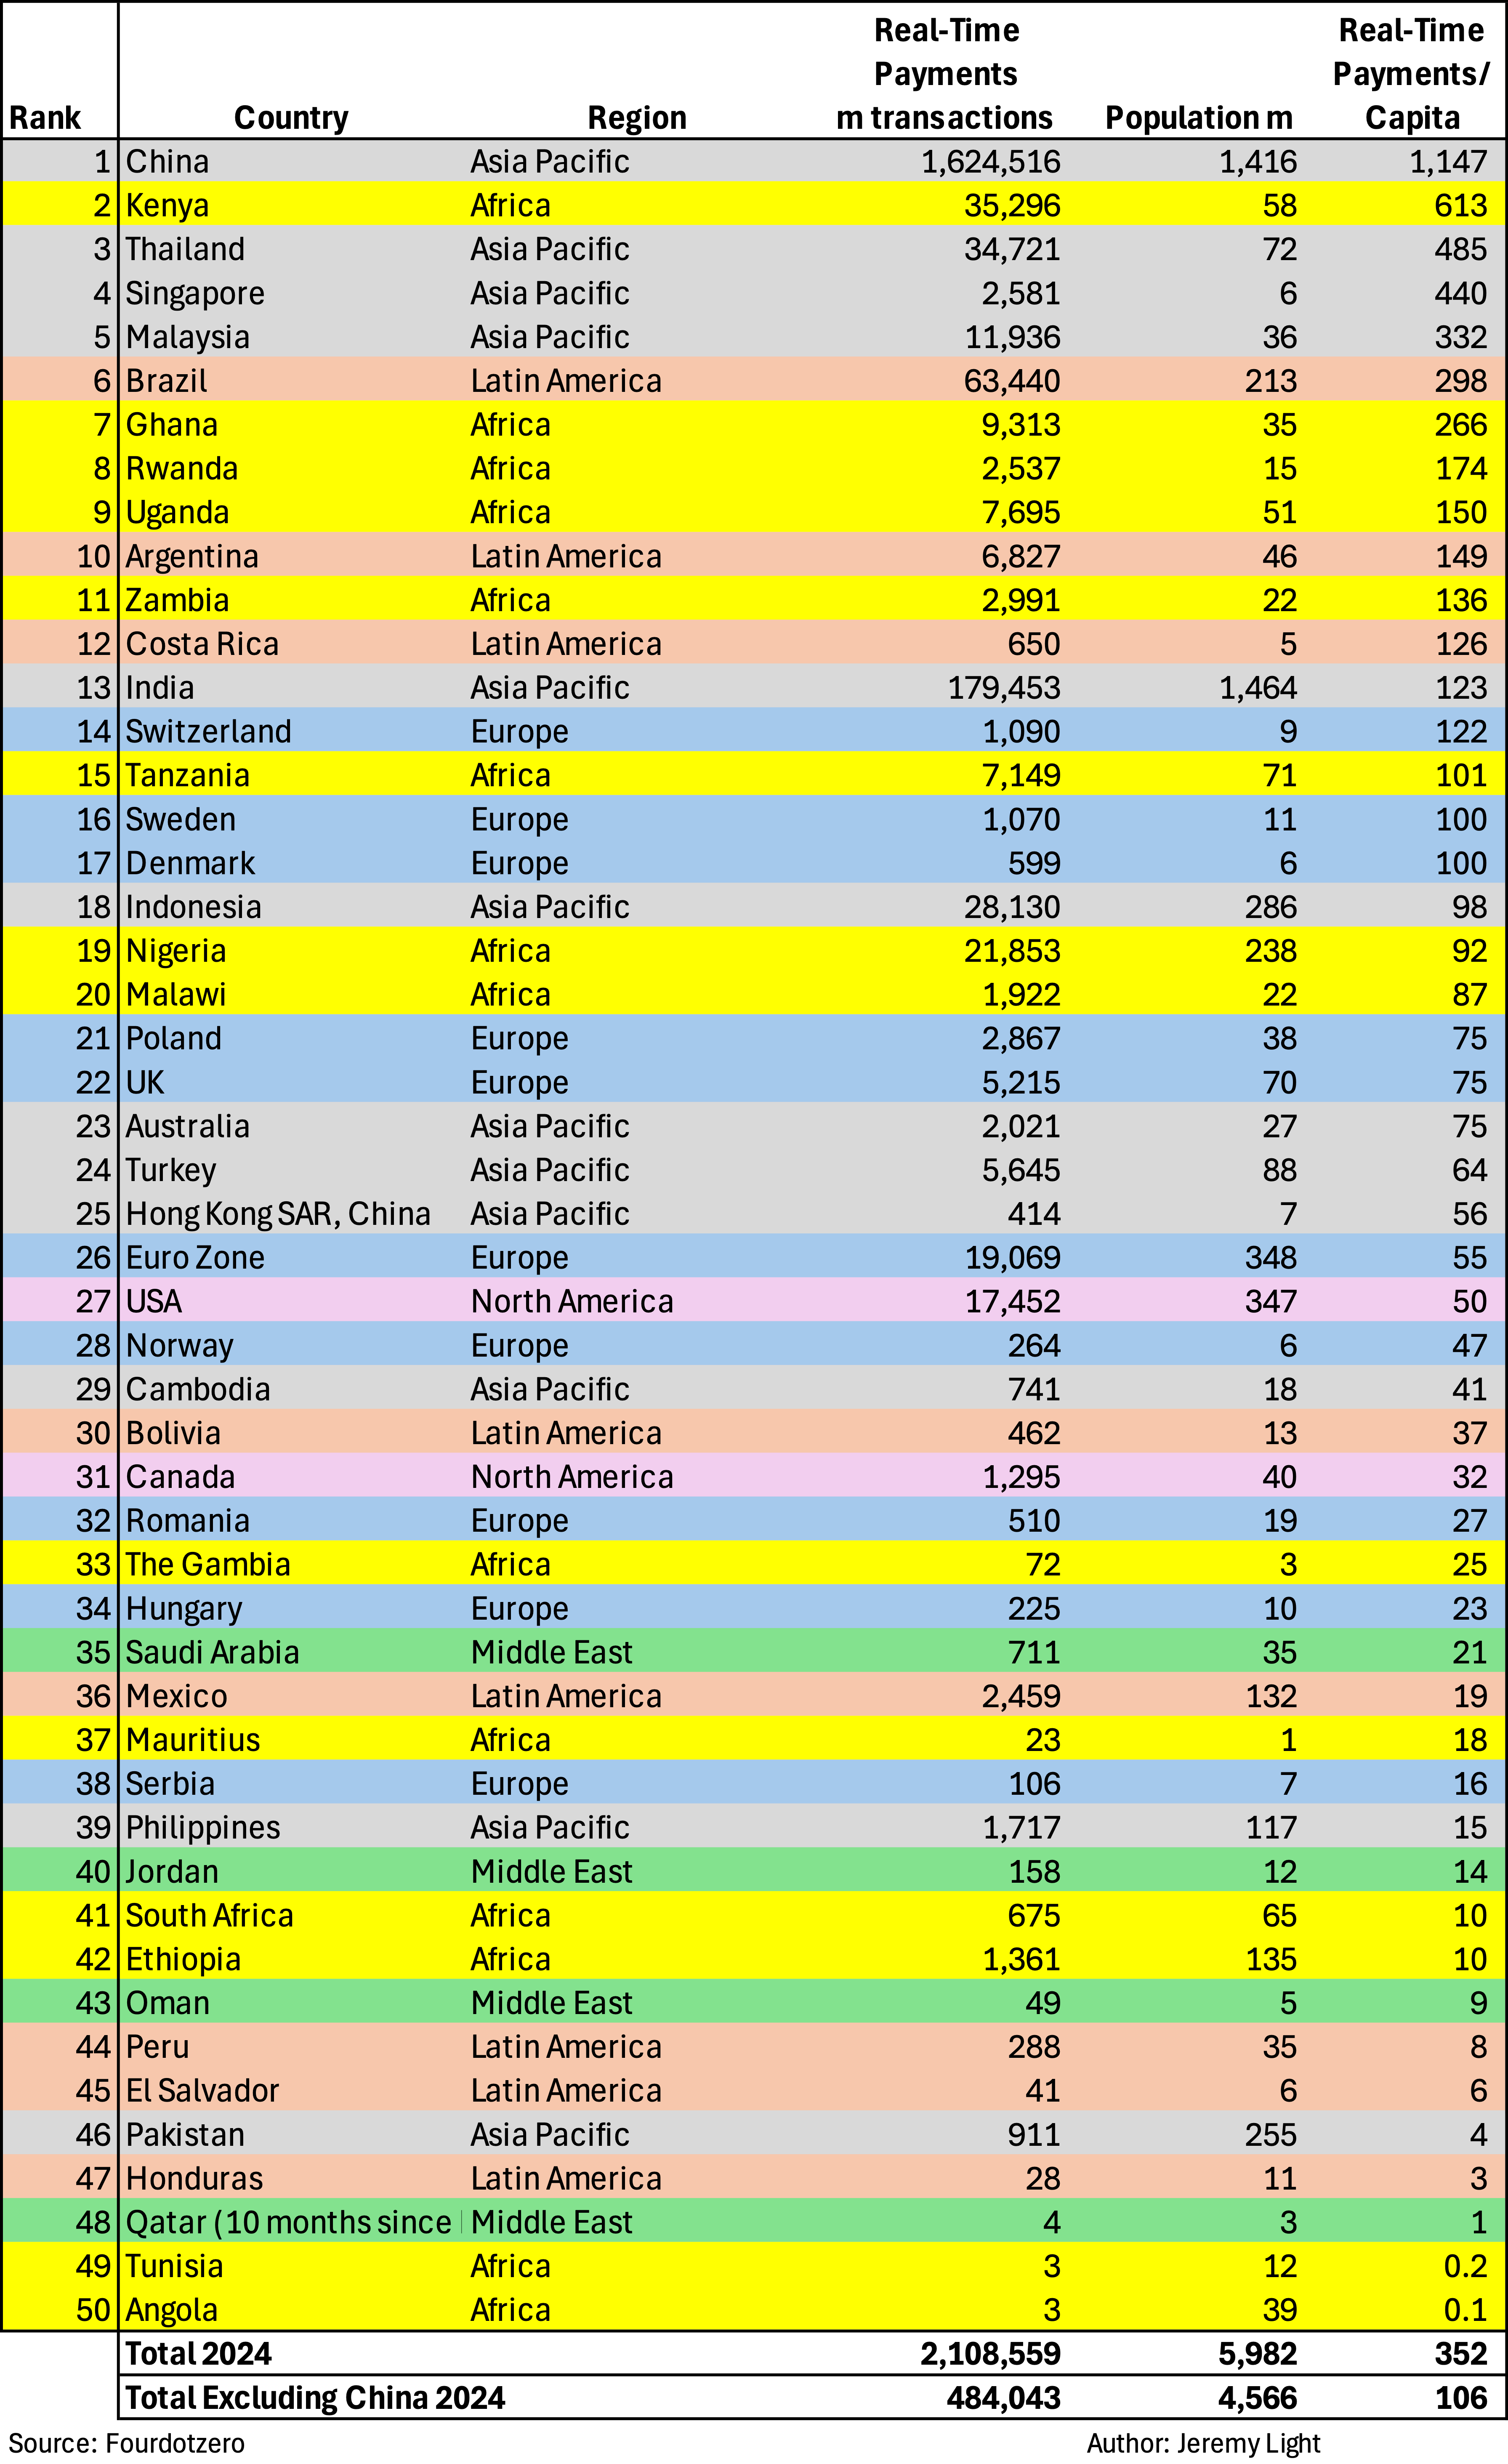
Table 1- Real-time payments per capita country ranking (countries colour coded by region)
Other Countries
Although many countries publish their real-time payment volumes, usually through their central bank or payment system operator, some countries with real-time payment systems provide no information. These are listed in Table 2. They will be included in future analysis if they publish data, along with any other countries that come on stream with real-time payments.

Table 2 – Other countries with real-time payments clearing (no data published)
Conclusion
Table 1 shows there is a wide range of real-time payment adoption rates across the 49 countries and the Euro zone. Those at the bottom of the rankings are just getting started while those at the top are still growing.
This wide range suggests that global growth in real-time payment volumes has a long way to go. To illustrate, if all the countries in Table 1 with adoption below the world average of 352 real-time payments per capita were to reach that average, then the total real-time payment volumes for the countries covered in Table 1 would grow by 1.2 trillion payments, a 55% increase, 240% excluding China.
As observed in previous articles, the drivers of real-time payment growth are digital wallets initiating account-to-account payments over real-time clearing systems (interbank or mobile money). Those countries with just online and mobile banking and no digital wallets are seeing lower rates of growth. Meanwhile, open banking has has yet to make a discernible difference to real-time payments growth but could do so if combined with digital wallets.
The metrics presented here and in the previous articles set a baseline for worldwide real-time payments adoption. It will be fascinating to see how they develop and how 2025 compares to 2024.
Methodology
I have used real-time payment transaction volume as it reflects interactions and usage. It also simplifies comparisons between countries as no currency conversion is needed. Included in real-time payments volumes are interbank payments, stored-value account payments including mobile-money, payments between bank accounts and stored value accounts and on-us payments between accounts held at the same institution.
Payments need to clear real-time between payer and payee accounts to be included, although settlement between institutions may occur later. Real-time card authorisations are excluded. All payment types are covered: business, consumer, government. Payments are classified as real-time only if available 24/7 (volumes on systems that are real-time but operate only during business hours are excluded e.g. Japan).
Country populations vary in size considerably, from 1.3m in Mauritius to 1.5bn in India. To make meaningful usage comparisons between countries, I divide the real-time volumes by the population size.
Unless published (rarely), on-us transaction volumes are estimated from interbank clearing volumes, typically around 20% (but depends on the number of banks and their number of accounts connected to the clearing system).
The world and regional averages are calculated as the total real-time payments volume for the countries covered, divided by the total population of those countries.
The data used is that published by central banks or by payment system operators.
Links to the six articles analysing each region:
PBOC Payment System Report 2024: http://www.pbc.gov.cn/en/3688110/3688259/3689026/3706133/5188172/5649949/2025040114593718714.pdf